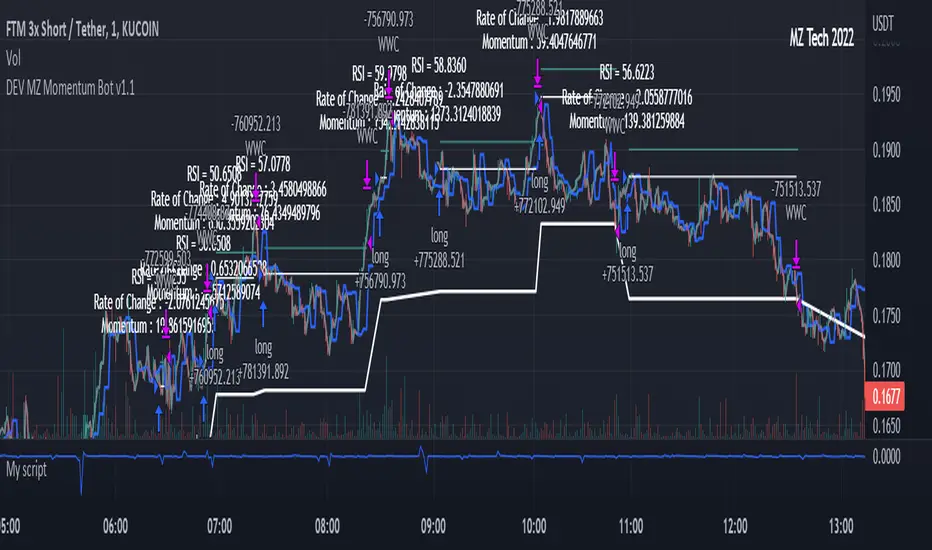
MZ Momentum Non Repainting HTF HFT Scalper BotThis is an original script meant to be a high frequency trader that works on higher time frame calculations. I came up with the idea that using calculus I can figure out the actual rate of change and momentum with different calculations than the momentum indicator that is provided by trading view. Once momentum is shifted on a small time frame, it will provide an entry signal. The script is meant to be used on an algorithmic trading system for scalping purposes. It should be run on a one minute time frame.
Set it up on a one minute chart - setup your bot on a one minute interval.
Find the source of your data. You can use any time frame, open, close. high, low, olc4. Open is pretty much guaranteed to not have any repainting issues - although all the other calcs use a custom isbarconfirmed security repaint calculation.
Set your rate of change period - typically I use a one minute time frame for this as well - but set my length fairly long (30-40).
Then set your period for momentum calculation. This will sample the rate of change data to figure out your momentum. I typically try a setting of 6-8. If that doesn't work, try setting it about the same as the rate of change period and add or subtract a few from there.
Unfortunately due to various plotting constraints in Pinescript, you cannot plot the rate of change and momentum and price in the same.
Set your trigger point. I try values -30, -20, -10, 0, 1. Then finesse to get an earlier entry signal. You should account for a slight delay from the signal to the actual entry. Your backtest should test well, but please note that does not gaurantee results. In my findings, I have seen that there is a slight minimal delay between signal to entry and that can make the difference whether your trade is profitable or not.
Use the show data to show you additional data when you are backtesting. This can allow you to try to filter out results or market conditions that do not work. I typically work with the RSI and use the 30 minute and 15 minute RSIs. I make sure that it is trading within a certain band - about 40-75. You can try the inverse and only buy during really low RSI's as well.
Use the enter and close messages to setup your webhook messages. But I recommend to allow the algo trading platform to close the trade for you based on their calcs since that platform knows the actual price level and when it has become profitable.
Filters have been setup for
Moving Average Variants - any time frame, any length.
RSI - Any time frame, any length,
Future Plans: ATR Filter so you can filter out low volatility periods.
Send me a message with any suggestions.
Cerca negli script per "the script"
Unicorn Quant Strategy [Astride Unicorn]Deeply customizable trading algorithm with instant back-testing. Its position management and trading signals engines emulate every step of the trading process and display all the actions on the chart. For example, the algorithm shows when to enter or partially close a position, move stop-loss to breakeven, etc. The trader can use these signals in their decision-making and replicate these actions in their trading terminal. The script can also send real-time alerts to the user’s Email.
The trading signals feature calculates entry signals for momentum and trend trading. The calculation is based on trend filtering using our custom filter based on rolling historical volatility. The historical volatility is used to distinguish the market regime and determine the current trend direction. In its calculations, the algorithm uses linear regressions instead of averaging. As our practice shows, it helps to reduce signal lag while keeping the number of false signals low.
HOW TO USE
Set stop-loss and up to three take-profit levels, choose rules for moving the stop-loss level, adjust sensitivity of the entry signals and see the back-test result immediately. If the performance of the strategy satisfies you, proceed with the forward-testing or live-trading.
When using this script, please, keep in mind that past results do not necessarily reflect future results and that many factors influence trading results.
SETTINGS
Use Starting Date - when the flag is turned off, the algorithm uses all available pricing data to calculate back-tests; when turned on, back-tests start from a starting date the user can select in the setting below.
Starting Date - sets a starting date for back-testing.
Trading Signals
Trade Length - defines the length of the trades the algorithm tries to calculate entry signals for. Recommended values are from 1.0 to 6.0.
Sensitivity - controls the sensitivity of the trading signals algorithm. The sensitivity determines the density of trading signals and how close the trailing-stop levels follow the price. The higher the value of this parameter is, the less sensitive the algorithm is. High values of the Sensitivity parameters (100-500) can help to withstand large price swings to stay in longer price moves. Lower values (10-100) work well for short- and medium-term trades.
Signals Type - In the Signals Type dropdown list, there are two options: Market Timing and Market Bias. Market timing is a type of trading signaling when the algorithm tries to find a perfect moment to enter and exit a trade. Market Bias is the type of trading signaling when the algorithm tries to be in a position all the time. When a trade is closed, the algorithm determines a direction to which the market is currently “biased” and immediately opens a trade in this direction.
Position Management
SL - sets stop-loss level measured as a percentage of the trade entry price
TP1, TP2, TP3 - sets take-profit levels measured as a percentage of the trade entry price
Close % at TP1, Close % at TP2, Close % at TP3 - Sets portions of the open position(as a percentage of the initial order size) to close at each of the TP levels
At TP1 move SL to, At TP2 move SL to - Sets the rules for moving stop-loss level in an open trade to protect the floating profit
Dashboards
Active Position Information - turns on/off a dashboard that shows the current SL and TP levels for the active position.
Recommended SL,TP Settings - turns on/off a dashboard that shows recommended settings for the SL and TP levels.

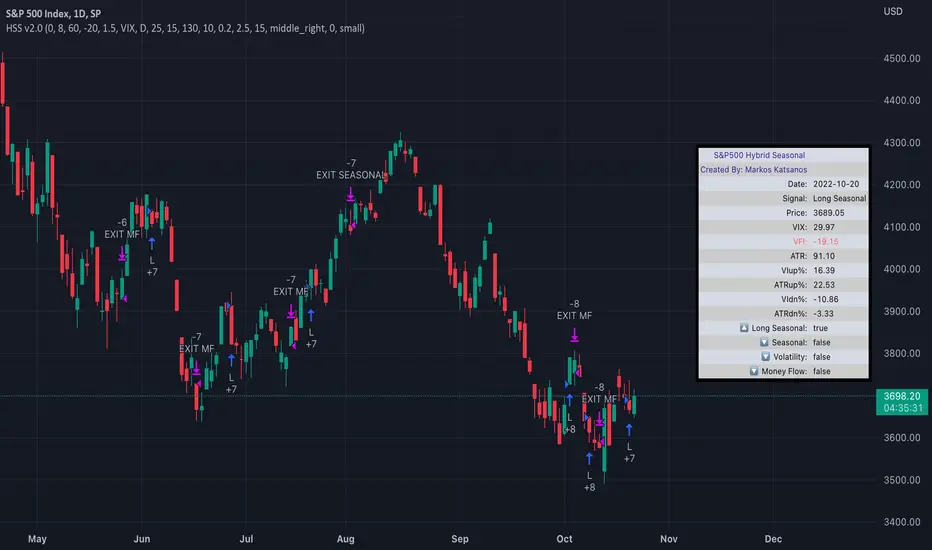
TASC 2022.04 S&P500 Hybrid Seasonal System█ OVERVIEW
TASC's April 2022 edition of Traders' Tips includes the "Sell In May? Stock Market Seasonality" article authored by Markos Katsanos. This is the code implementing the "Hybrid Seasonal System" from the article.
█ CONCEPTS
In his article, Markos Katsanos takes an updated look at the "Sell in May" adage by reviewing recent historical data for seasonal equity market tendencies. The author explores the development of a trading strategy (a set of buy and sell rules) based on this research.
He starts from the enhanced buy & hold system featured in his July 2021 TASC article, and adds additional technical conditions. These include volatility conditions ( VIX and ATR ) plus the "Volume Flow Indicator" (VFI), which is a custom money flow indicator that Katsanos introduced in his June 2004 TASC article. He provides an example of a trading system that others can test for themselves and modify as they see fit. The author notes that the system could likely be improved further by adding money management conditions (such as a stop-loss), or by adding more technical conditions not considered in the scope of this article.
█ CALCULATIONS
The entry and exit rules that constitute the trading system are defined below. The critical values of VIX, ATR and VFI (specified below) used in the calculations were determined by optimization for a daily chart of the SPY ETF . By default, the strategy only allows long entries. However, the script offers the possibility to initiate short entries upon exiting long trades through the "Long Only" toggle in the script's inputs.
Long Entry Rules
• Seasonal: The seasonal trade is initiated on the first business day October at the open.
• Volatility: In case of high volatility, that is if the VIX is above 60% or the 15-day ATR was above 90% over the past 25 days, the seasonal trade is deferred until later in the month or year, when the volatility subsides.
Exit/Short Entry Rules
• Seasonal: The exit/short signal is triggered on the first business day of August at the open.
• Volatility: The exit/short signal is triggered if VIX is above 120 % (i.e. 2 times the corresponding threshold parameter).
• Money flow (VFI): The exit/short signal is triggered if the VFI crosses under a critical value (-20) while its 10-day moving average is pointing down.
Join TradingView!
Titan EMA Averaging Strategy - (DYOR) By MrCryptoTitan EMA Averaging Strategy (VIP Only) Enable Longs or Shorts only Works With Crypto + Forex with correct back tested settings This is not set and forget. This requires you to back test and have relevant Risk Management in place.
The Strategy: The script uses 3EMA with engulfing candle to enter a trade in either short or long direction.
You will need to test the settings and adjust them so there isn't too many - re-entries and make sure you take profit big enough to not trigger on same candle.
When setting alerts you can use once per bar however this may trigger multiple alerts if the candle is moving very fast so this is not recommended. So doing once per bar close will mean entry is confirmed as bar is closed. You will need to select this in drop down menu.
- Max Trade Limit.
- All in one Alert. - Basically add syntax for example- Long/Take Profit/Re-entry/Emergency Stop. Then add one alert and select "Alert() function calls Only" Change Alert name to custom. That's it.
-Built-in Strategy tester.
- Trade Filter - Multi-MA Filters. - MA", "EMA", "WMA", "HullMA", "VWMA", "RMA", "DEMA", "TEMA", VWAP
- ADX Filter based on Level.
Please note when running this strategy you can only trade longs only or shorts only for this setup to be potentially profitable. Also note that setting unrealistic profit targets will make a loss. So it is very important to back test everything.
This Script does not use any Security functions. All indicators which are used part of the strategy are obtained from Trading View indicator Library and have source code has been changed to make this into Strategy.
Please Do Your Own Research before using this.
Anymore information please DM me directly

CryptoGraph Multi Algo StrategyThis is a summary of how this strategy works.
CryptoGraph Multi Algo Strategy is the second profitable real-time trading strategy by the CryptoGraph team, that generates trade signal with exact entires, exits and risk management. The strategy is intended to work nearly every crypto coin pair, stock or index.
Principles behind the strategy
Entry:
Detection of trend direction with the use of an EMA . Default setting is a length of 550.
Detection of shorter term trend direction with the use of multiple Supertrend Indicators.
Detection of an even shorter term direction with the use of a crossover of the Stochastic RSI , below or above certain levels. This would be the final condition for an entry signal.
Exit:
Once an entry signal has fired, the script will look at the current ATR Value. In the script settings there will be an option to adjust the ATR factor. While ATR factor is equal to 1, it means it will use the default ATR value distance from the candle close. When ATR factor is for example 2, it will use two times the ATR distance from the candle close.
This is a simple representation of how this strategy works, in reality there are more underlying factors.
To find the best settings for the crypto coin pair or stock you want the strategy to trade with, simply switch up the EMA , ATR Profit Multiplier and ATR Stop Multiplier and experiment which settings would fit your style best.
What to look for when testing coins or stocks?
EMA, default exponential moving average is set to 550. When above the line, it will only look for longs, when below it will only look for shorts.
The Take Profit and Stop Loss are based on ATR multiplications, adjust these in the inputs interface and you will see the exits change.
Default parameters of the strategy
This is only an example of a profitable combination of all parameters. This would be the 30 minute timeframe Bybit chart on Bitcoin.
ATR take profit at x2, ATR stop loss at x4.1.
In this example we are using an initial capital of $1.000,- while each trade 100% of this capital is used and compounds over time. Meaning every profit or loss will be added to the next trade. Also there is a 0.05% commission used based on Bybit, since we expect most trades to market in and limit out.

Zendog V3 backtest DCA bot 3commasMAJOR UPDATE:
- Update to Pinescript v5
- MAJOR refactor for the logic of how orders are placed. BO order is placed when the condition is first encountered and we are not in a deal.
The extra SO orders (if based on price movement) are all placed on the next candle after BO order, instead of each being placed one after another.
Take profit (if percentage) and Stop loss are placed on the first candle after BO order because if BO and TP are on the same candle TV does not execute properly.
These changes should improve strategy accuracy when multiple prices are hit by the same candle.
- NEW FEATURE: Support to Stop deal using an external indicator (i.e. stop long deal when RSI > 80)
- NEW FEATURE: Support to trigger Safety orders using an external indicator (i.e. trigger each additional SO when RSI < 10, regardless of price movement)
The price movement logic may be implemented in the indicator that plots start / end signals. The SO size is calculated using the configuration of steps.
- NEW FEATURE: Safety order command for 3commas bot. This is implemented using Add funds in the quote currency (for pair BTCUSDT the quote currency is USDT)
The SO size is calculated using the configuration of steps, for exact order size (and price) use the built-in Steps table.
- NEW FEATURE: Addition of extra columns to the steps table: Required price for TP, Required % change for TP, Required % change for BEP (Breakeven point)
- Update to steps table to remove prices when Safety orders are not based on % price change
- The code is opensource. I will not be able to sustain merges for the script, but feel free to use and develop your own version and ping me on discord to review them
and maybe include in the original script

AlphaScalp [Backtest, No RealTime]AlphaScalp tries to find volatility moves and profits from the small pullbacks.
Even though the performance of this script in a fair amount of cases will beat HODL it is not the purpose. AlphaScalp aims for a high accuracy and profitfactor to ensure a more or less stable profit taking.
The properties like " MA Length " and the " Short - " or " Long line % " tweaks the risk by increasing or lowering the requirements for a buy (Long or Short). Close/Exit of each order is then handled by TP, SL or volatility stop.
For high volatility assets it is recommended to use the " Sell LONG on Volatility DOWN " and " Sell SHORT on Volatility UP " to ensure a TA approach for StopLoss. Normal SL is also possible to set but is not recommended on high volatility assets since you quickly can be stopped out by wicks.
AlphaScalp works best on high volatility assets with a solid liquidity and volume - but it will also work on stocks and low volatility assets.
AlphaScalp is designed for scalping and is thereby recommended to use between 5M-1H.
This version is free for your to backtest on all assets - but be aware that alerts on RealTime bars are disabled - meaning you can add alerts but they will not trigger in real time. To ensure you have the latest backtesting results, you need to have the script added to your chart, save your chart and the refresh the page.
Enjoy and please let me know if you have any questions

B.Bands | Augmented | Intra-range | Long-OnlyHere you have the essential trading engine based on Bollinger Bands .
The idea behind is to trade the intra-range of the bands.
How is going to work?
Define which Bollinger Bands we want to use. Classic Bollinger Bands or Augmented Bollinger Bands . Without selecting, the algorithm doesn't show a strategy.
Define the length of the Moving Average and the Standard Deviation by default the classic 20-2.
Define the Bollinger Bands Spread Max Range (Upper-Lower) to be able to determine wheter or not you're in a price range or potential breakout.
Define data source to trigger exit and entry points.
Define profit based on Middle Band or Opposite Band.
Define Stop Loss % and activate Trailing Stop if desired with the percentage required.
Determine if you want to sell only on profit after triggering the entry signal. * Note Stop Loss remains activated.
Choose a date range if you want to study a specific period.
Bear in mind, this is the essential trading engine, open for you to test, try and improve under your requirements. You can determinate when is the ideal market to implement it based on many other indicators. Maybe you wish to change the stop loss settings for ATR, previous low, etc. Totally up to you.
Note the script comes with initial capital, fee % and slippage by deault. This may change for your assets. Make sure you define it in advance.
NOTE: If you trade assets such BTC, you must update the initial capital. By default 5000 (USD) The script doesn't support fraction trading such 0.01BTC.
Will be updated on next version.
Feel free to get in touch if you've got any question.

Simple/Compounded Returns & Drawdowns TableVery excited to bring this script to the public. This is a very useful table that displays the performance of any strategy you give it in a more detailed view. It runs on all timeframes and at any position on the chart with the replay function. It also updates on tick changes. The table consists of three modes: Simple Equity, Compound Equity and Drawdown.
Simple Equity – shows the change in equity for every month and year. It is calculated by finding the difference in initial equity at the beginning of the month/year and the end of the month/year. The table will thus display strategy performance in blocks of time that are not correlated. It is an excellent way to see individual month/year performance from start to finish but it may not represent true change in equity over time. For example, let's assume that 100% of equity is used on every trade for simplicity. If a loss of 50% is made in the first month and a profit of 100% is made in the next month, the strategy will show 50% profit for the year. This aggregate value might be helpful to know for testing purposes, but in reality, the account is actually at break-even for the year (Initial Equity * 0.5 * 2 = Initial Equity).
Compound Equity – shows compounded change in equity for every month and year. It is calculated by finding the difference in starting equity when the strategy is run and equity at the end of the month/year. The table will thus display the true strategy performance – compounded equity at the end of each month/year.
Drawdown – shows max drawdown for every month and year. It is calculated by finding the difference between the highest equity achieved for the month/year and the trough in equity for the same month/year. Notice: strategy tester might have a max drawdown value higher than any of the drawdown values in the table. This is because the strategy tester calculates the difference between the highest and lowest equity for the entire strategy, whereas the table displays drawdowns for months and years only. Sometimes, the max drawdown for the year will also be the max drawdown for the entire strategy; hence the two values will be the same.
To use this table with your own strategy, simply find " PLACE YOUR STRATEGY CODE HERE " at the bottom of the script and place your strategy code there. Special thanks to QuantNomad for the inspiration. As always, please let me know if there are any bugs or if you need some help. Leave a like if you wish!

Smoothed Waddah ATR~~~All Credit to LAZY BEAR for posting the original Script which is an old MT4 indicator.~~~~
No this system does not repaint... if it does let me know. Either the code is wrong or you are using a repainting chart such as renko candles.
*PURPOSE*
This Is an "Enhanced or Smoothed" version of the script that captures the heiken-ashi closing price as its main calculation variable. While using normal bar or line charts. Enhancements integrate trade filters to reduce false signals.
*WHAT TYPE OF TRADING STRATEGY IS THIS?*
This is a Long Only, Trend Trading System. Is intended to be applied to Charts/Timeframes that produce sustainable trends for which ever asset you are trading.
*NOTE OF ADVICE REGARDING SETTINGS*
Settings can be tweaked but I have found that best results come with the given settings. If a chart is too choppy to trade this indicator successfully, it is advised not to change the settings but either find a different timeframe or different asset to apply this strategy to.
TLDR
Indicator measures the change of the MacD (difference between MAC D of given EMA's) and compares it to the difference between the Upper and Lower Bollinger bands. Green bar over trigger line= entry. Red bar over trigger line = close.
*SETTINGS AND INPUTS*
-MacD of HeikenAshi chart (will always be of the Heikenashi chart even when applied to different chart type)
sensitivity = input(150, title='Sensitivity') =range should be (125-175)multiplier so that MacD can be compared to BB
fastLength = input(20, title='MacD FastEMA Length')
slowLength = input(40, title='MacD SlowEMA Length')
-Bollinger Band of currently used price chart type
channelLength = input(20, title='BB Channel Length')
mult = input(1.5, title='BB Stdev Multiplier')
-14 Period RSI Trade Filter (set to 0 to Disable)
RSI14filter = input(40, title='RSI Value trade filter') =only gives entry when RSI is higher than given value
*ABSTRACT & CONCEPT*
TLDR - Indicator measures the change of the MacD (difference between MAC D of given EMA's) and compares it to the difference between the Upper and Lower Bollinger bands. Green bar over trigger line= entry. Red bar over trigger line = close.
Indicator plots -
Bars are the change in the MAC D and the indicator line is the difference in the BB.
When Bars are higher than the indicator line then it is considered a trend "Explosion"
Green Bars are Trend Explosion to the upside, Red Bars are Trend explosion to the downside.
GENERAL DETAIL-
the core calculation is measuring the change in MacD of current candle compared to the MacD of two previous candles.
This value is multiplied by the sensitivy so it can be compared to the change in Bollinger Band Width.
if the MACD change is positive then you get a green/lime bar for that value. If the MacDchange is negative you get a red/orange bar for that value.
and are determined by whether the actual change is increasing in that direction or decreasing. (bars getting taller or bars getting shorter)
Entry signal for long is A positive change in MACD difference (Green bar) that is greater than the change of the bollinger band (orange signal line) AND if the RSI value is above your filter.
Close signal or Trend Stop Warning Signal is given when a Negative MacD Difference (red bar) is greater than the change of the bollinger band (orange Line)
*CONSIDERATIONS AND THOUGHTS*
I have over 150 iterations of this indicator and this is the most consistent and best version of settings and filters I was able to generate. I built this indicator specifically for 3 charts. SPY monthly, QQQ monthly, BTC 3 Day. However this indicator works well on any long term bullish chart. (tech stocks are great) .
Trend trading systems are intended to be homerun hitting, plunge protecting indicators that allow for long legs and expanding volatility. This indicator does this as the trigger line is Dynamic with the expansion and contraction of the bollinger band.
I do not take every signal specifically not the close signals. Instead they more like warnings in ultra bullish environments.
If i had to pair this indicator with any other filter than the RSI, it would be a long term moving average i.e. the 50 week or equivalent for your chart. signals above rising moving averages means that you are trading with an upward trending market.
Hope this helps. Happy trades.
-SnarkyPuppy

when bull D timeframeEcco a voi la mia strategia basata su atr con implementazioni personali per definire facilmente la condizione di mercato su btc e eth, come potete vedere punta ad identificare solo le salite più importati ignorando i falsi segnali che avvengono nelle fasi di bear market (o di incertezza). Da utilizzare con timeframe D.
Condivido una versione disponibile e funzionante gratuitamente fino al 31/12/2022 dopo tale data lo script tornerà a pagamento.
Here is my strategy based on atr with personal implementations to easily define the market condition on btc and eth, as you can see it aims to identify only the most important climbs ignoring the false signals that occur in the bear market (or uncertainty) phases. For use with timeframe D. I share a version available and working for free until 31/12/2022 after that date the script will return not for free.
Stay Tuned

Rising ADX strategyI have always been a huge fan of ADX. Its good for finding out good trending moves.
But it has been said that only ADX after 20 or 25 is good for trending market, but few trend gets completed at that level.
So I have come up with a logic to find out the rising ADX. This could be used to determine the trending moves from the start.
Buy signal:
When close is greater than moving average 1 and 2. This moving average can be SMA, EMA, WMA or HMA.
When ADX is greater than the threshold range. I have taken 10 as my minimum range.
Of course important of all ADX should be rising which implies trend is about to start.
Buy exit:
When close is less than moving average 1 and 2. This moving average can be SMA, EMA, WMA or HMA.
When ADX is lesser than the threshold range. I have taken 10 as my minimum range.
ADX falling which implies trend is about to end.
Sell signal:
I don't repeat the above logic again.
Everything similar to buy signal except above moving average. For selling it should be below moving average.
Strategy can be tested for long and short sides.
Note: No Repainting as the logic is very simple.
Using this script we can identify the best timeframe the script trend yields profit.
Test and provide your comments.

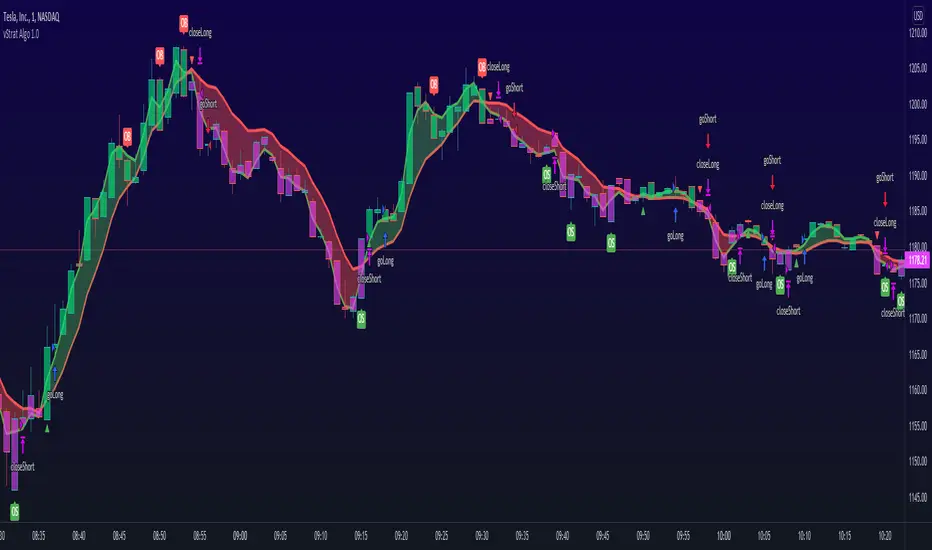
vStrat Algo 1.0 (BETA)vStrat Algo 1.0
The Very First Scalping/Intraday Trading Algo for Options
Note: If you have any favorite indicators that you use regularly and are helpful, feel free to use them in conjunction to this strategy.
Legend:
long = buy call
short = buy put
close entry = sell call/put
BULL = bullish engulfing
BEAR = bearish engulfing
OS = oversold
OB = overbought
Instructions:
1. You can choose to watch the 3 minute or 5 minute chart but be aware of the Pro’s and Con’s. It’s not recommended to use this strategy on the 1 minute chart, but this works on higher timeframes. Keep in mind that the signals will vary on each timeframe.
3 minute 5 minute
i.ibb.co i.ibb.co
2. It’s best to use this strategy right at market open. If a “long” (buy CALLS) or “short” (buy PUTS) signal was given at pre-market, I do not recommend taking it. Only take signals once the market opens. If you really wish to take the signal that was given 1-5 minutes before the market opened, you most definitely can, but its’s just riskier. What I would do is, wait 3-10 minutes after market open and if one Moving Average is respecting the other and holding above or below it, you can enter especially if the blow is bullish, the vStrat Algo 1.0 will also tell you if the candles are bearish or bullish. Use your best judgement.
i.ibb.co [
3. You do not have to wait for the exit signal, everyone's risk management is different so take profits whenever you're green or hold as long as the short-term MA is still trending above or below the long-term MA and is not touching or bouncing off it.
i.ibb.co
4. Avoid taking any signals from 11:30 AM ET - 2:30 PM ET, when stocks are trading sideways since the algo’s stop losses get triggered here due to the low volume.
i.ibb.co
5. Lastly, there is no magic indicator or strategy, this algorithm is designed based on multiple conditions. Each signal gets triggered when ALL the conditions are met. This strategy is based off advanced moving averages, one that reduces lag and responds quicker than the simple and exponential ones, RSI value, S/R, pivot points, and a few others. I’m always looking for ways to improve this scalping algorithm so rest assured any complaints or suggestions will be taken and fixed as timely as possible. For best results, avoid trading with your emotions. If you’re a new user, open a small position, set a stop loss, and let the algorithm decide how you will trade it for that day. Keep doing this until you get more familiar with the script then slowly increase your position sizing, but do not invest money you can’t afford to lose. Play with the settings, change the lengths if you wish, but the script was created to provide the most accurate signals as it is. If you do decide to change these inputs, the signals will also be different. Take profits whenever you see fit, the goal is to have a green day and grow your account slowly but surely. If you make a profit, do not risk giving your money back to the market by overtrading. Always do your own due diligence and use your best judgement. Good luck, Traders!
DISCLAIMER : All information found here, including any ideas, opinions, views, predictions, forecasts, commentaries, suggestions, or stock picks, expressed, or implied herein, are for informational, entertainment or educational purposes only and should not be construed as personal investment advice. While the information provided is believed to be accurate, it may include errors or inaccuracies. Conduct your own due diligence or consult a licensed financial advisor or broker before making any and all investment decisions. Any investments, trades, speculations, or decisions made on the basis of any information found on this site, expressed, or implied herein, are committed at your own risk, financial or otherwise.
RSI+CMO Hybrid StrategyThis strategy is based on the RSI+CMO Hybrid Index I created. I modified both the original RSI and CMO so that the RSI+CMO Index value ranges from -100 to +100 and defined as follows. When the RSI+CMO Hybrid Index values close above the Bull Level and below the Bear Level, the strategy will trigger long and short signals respectively. This newly defined hybrid RSI+CMO indicator showed better win rates and better profits than the original CMO strategy. The default setting for this strategy is optimized for an 8-hour candle. For candles at different times, try to find the optimal value yourself.
* I was going to open the script, but recently there was a case of stealing my script and publishing it without permission, so I decided not to disclose it.
▶ Modified RSI = Original RSI - 50
Therefore,
Original RSI (0 ~ 100) → Modified RSI (-50 ~ +50)
▶ Modified CMO = Original CMO * 0.5
Therefore,
Original CMO (-100 ~ +100) → Modified CMO (-50 ~ +50)
▶ RSI+CMO Hybrid Index = Modified RSI + Modified CMO
Therefore,
RSI+CMO Hybrid Index (-100 ~ +100)
________________________________________________________
이 전략은 기존의 RSI와 CMO 지표를 수정하여 새롭게 정의한 하이브리드 RSI+CMO 지표를 기반으로 만들어졌습니다. 지표 값의 범위가 -100에서 100의 범위를 가질 수 있도록 기존의 RSI와 CMO를 수정하여 만들었습니다. RSI+CMO Hybrid Index 값이 Bull Level 이상과 Bear Level 아래에서 봉마감을 하면 이 전략은 각각 롱과 숏 신호를 트리거합니다. 이렇게 새롭게 정의된 RSI+CMO 지표는 기존 CMO 전략 대비 승률과 수익이 더 우수합니다. 이 전략의 세팅 기본값은 8시간봉에 최적화 되어있습니다. 다른 시간대 봉에서는 최적값을 직접 찾아보십시오. 그리고 이전략은 RSI+CMO Hybrid Index와 함께 사용하면 Long과 Short 신호를 예측할 수 있어 편리합니다.
* 최근에 제 스크립트를 도용/표절하여 무단으로 퍼블리쉬한 사례가 발생하여 더 이상 스크립트는 공개하지 않기로 하였습니다.

1St Bar GAP+BkOut Screener v2 by RMFirst Bar Gap and subsequent conditions are used as one of the several strategies for Day traders.
This script runs on first bar and checks if the stocks has an initial Gap (up or down), then checks for next bars to be inside the boundaries of the first candle
you can customize this screener according to your requirement. There are a number of very clever people I have taken bits of code and ideas, thanks to you all :)
Used part of this code as published by @PineCoders and Public Libraries. Also add some power query code to help you create the symbols input in the script
Disclaimer: This is not a Financial advisory tool. For education purposes only. * Use at your own risk *
Outline:
gap up/ gap down on 1 min first candle -> good
2nd candle inside 1st candle -> good
3rd to nth candle to break out from first candle range -> good /alert/ Plot flag
//M (Excel power query) code to load and format watchlist from txt file format
//Input: , Output:
let
// replace and for the correspondign values in your computer
Source = Csv.Document(File.Contents("C:\ \ "), ),
#"Transposed Table" = Table.Transpose(Source),
#"Sorted Rows" = Table.Sort(#"Transposed Table",{{"Column1", Order.Ascending}}),
#"Added Index" = Table.AddIndexColumn(#"Sorted Rows", "Index", 1, 1, Int64.Type),
#"Changed Type1" = Table.TransformColumnTypes(#"Added Index",{{"Index", type text}}),
#"Inserted Merged Column1" = Table.AddColumn(#"Changed Type1", "Merged", each Text.Combine({"0", }), type text),
#"Inserted First Characters" = Table.AddColumn(#"Inserted Merged Column1", "Two Characters", each Text.End( , 2), type text),
#"Removed Columns" = Table.RemoveColumns(#"Inserted First Characters",{"Index", "Merged"}),
#"Inserted Merged Column" = Table.AddColumn(#"Removed Columns", "Merged", each Text.Combine({"s", , " = input( '", , "' , type=input.string)"}), type text)
in
#"Inserted Merged Column"
//--> once input string is created Copy&Paste in this code after // Symbols _ Use Power Query in Excel
// end of M code to load watchlist from txt format

Strategy TemplateTrying to include few basic things which is needed for strategy which can be used as template.
Few important components
Strategy parameters
Few important parameters include - initial_capital, default_qty_type, default_qty_value, commission_type, pyramiding and commission_value. All my strategies will have similar settings with initial captial set to 20000 to 100000. 100% of equity per trade with no pyramiding (set to 1) and minimal commission.
margin_long and margin_short can be used for leveraged trading. But, since we are not using pyramiding, it will make no effect.
Trade Limiting parameters
Two types of limiting is available in the scripts
Limiting trading direction : this is done through method strategy.risk.allow_entry_in and input parameter tradeDirection
Limiting trades to particular time window : This is achieved through adding start time and end time parameters of type input.time and check whether time is within this window
Custom Methods
customized security method to get higher timeframe data
customized moving average method to get moving average of any type
Custom Parameters
Moving average Type option list which I use quite often. Any strategy where there is need to use moving average, I try to scan through different moving average types and lengths to see which one is more appropriate for the given strategy. Hence, keeping this parameter in template to make it readily available when I start with new strategy
waitForCloseBeforeExit - this is used if trailing stop need to activated as soon as price hits the stop or only on close price. This is again something I switch quite often based on strategy. Hence, keeping this as part of the template.
Entry and Exit statements for long and short
These statements from line (57 to 62) can remain as is even with new strategy. Only thing to be set are variables - buyCondition, sellCondition, closeBuyCondition and closeSellCondition
Last but not the least
In pinescript, a long and short position cannot coexist in a strategy at any point of time. Any short positions created will automatically stop long positions and vice versa. Hence, it is important make short and long trades mutually exclusive. In this example, I have used 200 weekly moving average as trend bias. No short positions are taken when price is trading above 200 weekly moving average low/close and no long positions are taken when price is less than 200 weekly moving average high/close. Any rule built on top of this (In this case a simple supertrend rules) ensures that there are no conflicting signals and hence avoids confusing trades on the stratgy.

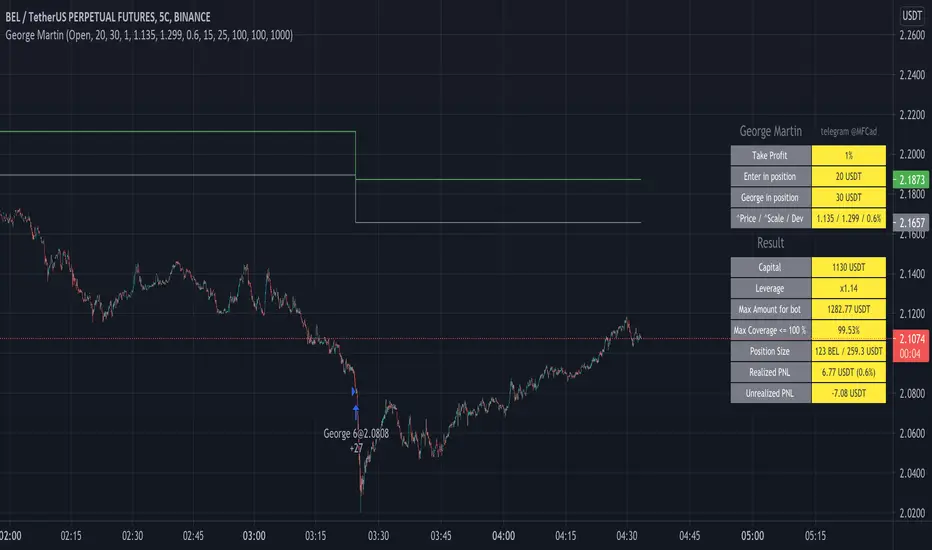
George MartinENG:
This script is based on a simple principle - MartinGale. Each subsequent entry, if the price goes in the wrong direction, increases the number of contracts taking into account the coefficient and also changes the entry price taking into account the coefficient. The coefficients can be configured so that the script keeps the drawdown up to 85%. For instructions and connection - write.
RUS:
Этот скрипт основан на простом принципе - Мартин Гейл. Каждый следующий вход если цена идет не в нужную сторону, увеличивает количество контрактов с учетом коэффициента и также меняется цена входа с учетом коэффициента. Коэффициенты можно настроить таким образом чтобы скрипт держал просадку до 85%. Для инструкций и подключения - пишите.
MACd+200EMAIndicator used:
MACD default values.
EMA 200
How the script works:
When MACD line Crosses the signal line below the 0 histogram value while candles are above 200EMA a buy signal generated .
When signal line Crosses the MACD line below above 0 histogram value while candles are below 200EMA a buy signal generated .
Default SL and TP:
By default I have set TP =20 pips and SL=20pips
How to manage the trades:
You can manage the trades according to your own rules.
This script shows only the BUY and SELL signal generation and EXIT points when the trade reach 20 pips profit or loss

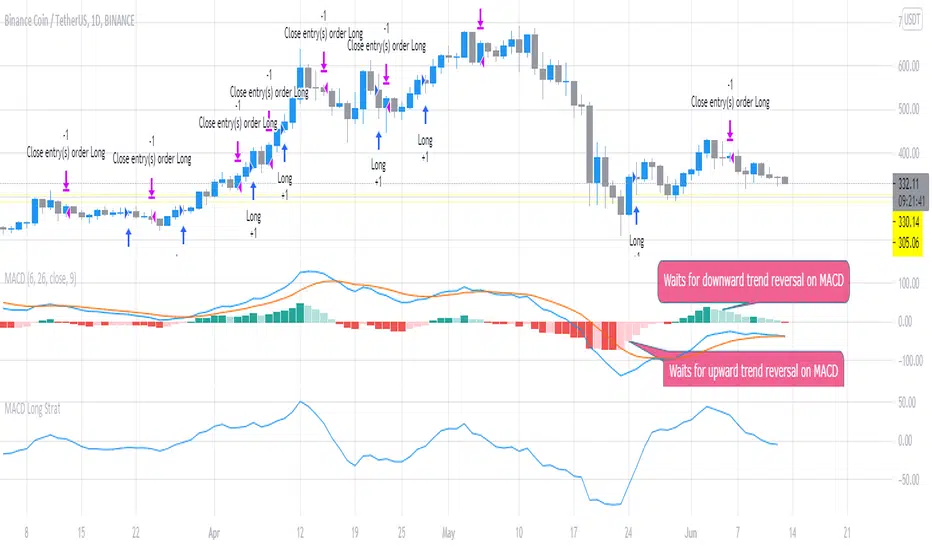
MACD Long StratFirst script I've written, but the concept is pretty simple. This uses the MACD with settings fast_SMA = 6 and slow SMA=16 and uses the distance between the 2 (histogram) to look for potential trend reversals to flag potential entries for Long trades. It waits for the confirmation looking backward 2 x timeframes (to reduce false calls slightly). You can adjust it to open / close quicker (1 timeframe instread of 2) but backtesting shows 2 timeframe delay is best to avoid false signals.
The script suggests Long entry points based on this criteria and uses the converse (reducing histogram / SMA difference delayed by 2 timeframes) to suggest exit or trade close points for downward reversal. It was originally written looking at 1m scalps but backtesting shows this is even more effective on higher timeframes (1D).
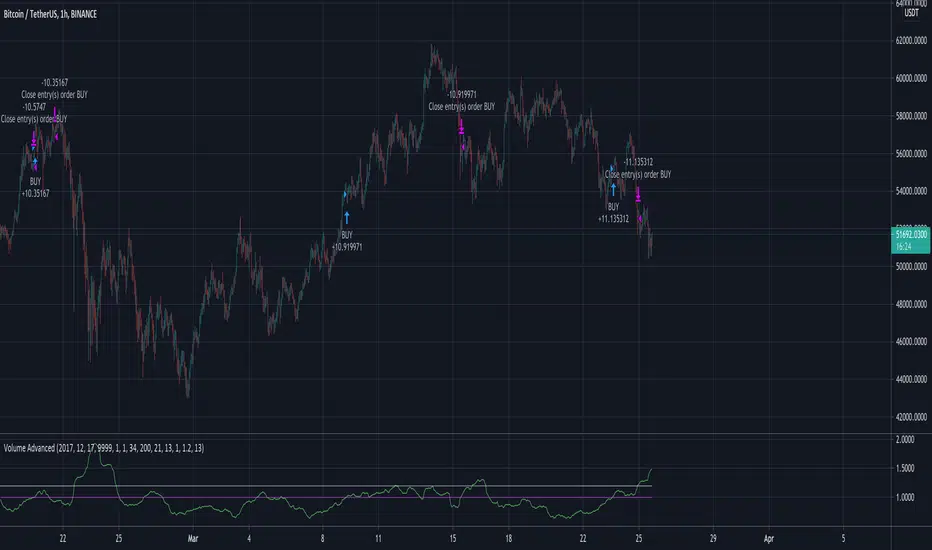
Volume AdvancedI have found out this script some time ago. In fact it is not my code (just have modified a little) and I don't know the author (couldn't find). So now I would like to share with the community, maybe somebody would have some idea how to make it better. The script itself is modified volatility oscillator (like ATR) based on volume, making a deal at the moment of price change. To recognize the current trend I have add simple function just to compare the current price with the N bars before, because sometimes in moments of high volatility there may be wrong signals.
Oscillator Evaluator (Analysis tool)Oscillator Evaluator (Analysis tool)
The oscillator evaluator is a tool that will help you analyse and compare the oscillator of your choice to another 2 oscillators.
By selecting the strategy with which you will analyze the oscillators, you will be able to see the behaviour of the oscillators in different aspects.
First there is a moving average increase or decrease strategy, that will give you a good idea of the correlation of the oscillator with the price.
The second is a commom 2 MA crossover strategy, that will give you and idea of the validaty of that oscillator as a strategy or as a trend filter.
The third strategy is a cross over 0 signal, that will go long on a crossover of 0 and short on a crossunder 0. This helps you see how good is the oscillator at evaluating suport and resistance areas and give you an idea of its balance.
The forth strategy is a Buy/Sell on extremes of the oscillator and will let you know how good is your strategy at spotting good places to buy and sell.
The fith strategy is to evaluate how goood the oscillator is as a mean reversion filter or how good it is at spotting small price changes.
The sixth strategy is similar to the last but is focused on how good is the oscillator spotting good places to take profits on trending strategies.
The 6 strategies in the script produce signals from the oscillator and from the oscillator only.
In conclusion this tool can be used to measure your oscillator and see if it really is as good as you think in comparison to others.
This script is not intended to be used as a full strategy but as a tool.

[DS]Entry_Exit_TRADE.V01-StrategyThe proposal of this script is to show the possible trading points of BUY and SELL based on the 15-minute chart of the Nasdaq Future Index. The start point of the strategy was schedule for 2021/01/01 and until the time of this publication (2021/01/31), for 1 index contract the results presented area a Gross Profit of 2.97% with a Net Profit of 1.35%.
█ FEATURES
The indicator shows on the graph the position of the MACD and TSI indicators that are the places of strength among Buyers and Sellers.
It's possible to observe a sharp fall or rise in the price of these positions.
On the current candle, a label is displayed containing the value of the William %R Mod indicator, which will display the OverBought position (dark red) and OverSold position (dark green). The other colors like light red and green are the regions where the price makes the decision of which direction to go.
There are also other indicators:
a) The positions of the BUY (light green) and SELL areas (light red);
b) The label with the position of BUY (dark green) and SELL (dark red) with the line that connects these points;
c) DEMA 72 (orange);
d) EmaOchl4 in the color green for BULL and red for BEAR market;
e) Pivots high and low
f) Maximum (purple light) and minimum areas (blue light)
█ FUNCTIONS AND SETTINGS
The indicator uses the following functions:
(1) DEMA - Double Exponential Moving Average (08,17,34, 72)
(2) ema () - Exponential Moving Averge (72, ohlc4)
(3) plot()
(4) barcolor()
(5) cross()
(6) pivots ()
(7) William R% Md (OverBought = -7, OverSold=-93)
(8) Maximum and Minimum Value
(9) fill()
(10) macd () - Moving Average Convergence Divergence (Fast Lengt=12, Slow Length=26, Source=close, Signal Smoothing=9)
(11) tsi() - Trading Strenght Indicator==> Índice de Força Real ( IFR ) (Long Length=72, Short Length=17, Signal Length=17)
(12) Buy and Sell TRADE Points
█ PERFORMANCE AND ERRORS
The positions of BUY and SELL points are defined through the crossing of the Dema 34 candles with the Ema Ohcl4. As it is an indicator, it can present different positions from de market direction. Thus there is a need to observe the direction of the market in order to verify whether the indicate decision is really acceptable. The decision to BUY or SELL an asset must be well studied to avoid financial losses. The indicator will only help you in this decision, is your responsibility the decision of entering or leaving an asset.
█ THANKS TO
PineCoders for all they do, all the tools and help they provide, and their involvement in making a better community. All the PineCoders, Pine Pros, and Pine Wizards, people who share their work and knowledge for the sake of it and helping others, I'm very happy and grate full indeed.
█ NOTE
If you have any suggestions for improving the script or need help using it, please send a message in the comments

ETH/USD 15m [iTradebot]1. General
2. Additional information
3. Access
1. This is a script for crypto trading strategies, based on following trends with moving averages.
A fast moving average and a slower getting crosschecked with MACD for buying/selling signals, those signals get crosschecked by 5 different factors, like the MACD or controlling average.
Only if all requirements will be met, the script expects the trend to change and sends an according signal.
This strategy is not made for multiple entries and keeps a position open until an opposite signal gets triggered.
It was built with ETH/USD 15min chart in mind, but can be used on any other chart, though you will have to find a different combination in inputs, to make it work with other pairs or timeframes.
Fast average: The faster of the two signal moving averages.
Slow average: The slower of the two signal moving averages.
Trend strength: Determines the crosscheck with the MACD.
Control length: Sets the period length for the control average (1=1bar, 300=300bars)
Inputs used here are:
Fast average: 5
Slow average: 19
Trend strength: 4
Control length: 306
Start capital: 1000
Trade equity: 100%
Commission: 0.036% (Binance)
Result 2020-06-11 until 2021-01-07
Net Profit: 717.56%
Percent Profitable: 54.17%
Max Drawdown: 8.79%
Profit Factor: 6.523
2. There are many combinations with good net profit outcomes, but make sure to also keep a low "Max Drawdown", to lower the risk substantially.
The combination we used, gives slightly less profit than other combinations, but also lowers the max drawdown from 20% to 9%.
In general in trading with crypto we advice to only use this strategy with Bitcoin or Ethereum , due to their high value and "stable" movements, compared to other cryptocurrencies.
The strategy is using 100% equity each trade, so make sure to have your capital management in place on the account.
To be specific, DONT put all your capital into this one strategy, but only part of it, according to your capital management.
Control lengths around 150 or 300 tend to give good combinations with the other 3 inputs. (on the 15min chart)
3. You can test this strategy 14 days for free and get access for up to 1 year on our website.
14 day free trial only requires Tradingview user name and e-mail.
Click on the link in our signature below.
